July 15, 2024
Major US equity indices were mixed in Q2, with the S&P500 and NASDAQ recording gains while others like the DJIA and Russell 2000 fell. The differences lie in the extreme concentration of a few large stocks driving the bus – more on that below. In the bond market, rates ticked higher in the second quarter, with the 10-year Treasury rising about 20 basis points. Expectations for Fed easing pulled back during the quarter due to slower progress on inflation readings despite mixed economic data. While consumer spending and business survey data have suggested slowing, employment trends have generally remained above expectations, giving way to hope that any economic slowdown could remain characterized as a soft landing. Exiting the quarter, the jobs data started to waver a bit. We expect employment trends will prove key to the degree of any slowdown and will be one of the more closely watched variables in the coming months.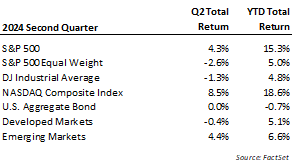
Even casual market watchers are likely aware that a small group of big tech stocks (Amazon, Apple, Google, Meta, Microsoft, and Nvidia) are having a significant influence on index returns, but drilling down further only exaggerates the contrast. Indices with little to no representation of these companies were, for the most part, down in the second quarter. The Dow, the equal weight S&P500, and the Russell 2000 small cap index were all negative in the second quarter. Looking at stock breadth, the number of advancing stocks less declining, shows the “average” stock was down in the second quarter. The chart below from Bespoke Research illustrates how breadth usually moves in the same direction as the S&P500, though that changed markedly in the second quarter.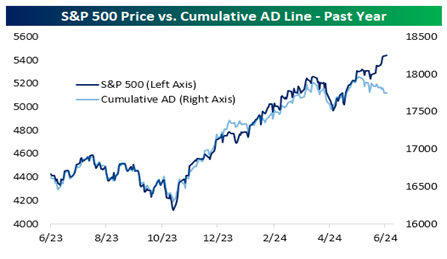
Looking at the composition of returns, the top six stocks contributed more than 100% of the gain recorded by the S&P500 in the second quarter. (The Magnificent Seven references have abated since Tesla has fallen back from the other six and seen a loss YTD.) Amplifying this point further, Nvidia and Apple, the two largest companies by market cap, made up over 70% of the gain registered by the S&P500 in the second quarter (source: The High Tech Strategist). For now, the big keep getting bigger at the expense of the rest and, as a result, expand their representation of the overall market. The combined weight of the six largest companies is now more than 30% (seven holdings because Google is counted twice for each share class). Analysis by Bloomberg and others has characterized this concentration as the most extreme in U.S. stock history. The chart below illustrates the difference in return between the weighted S&P500 index measure and an index of equal weights for each company.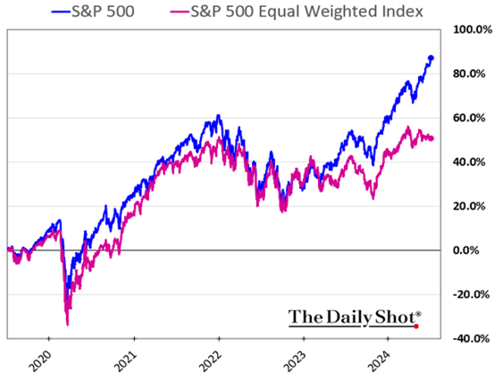
In our opinion, this raises an essential question of diversification for investors. Buying an ETF or mutual fund representing the S&P500 index was intended to simplify diversification across various industries and companies. However, as the largest companies outperformed, they became a more significant part of the index. As of the second quarter’s end, just over 1% of the 500 companies comprise over 30% of the S&P500 return. The market cap weighted structure applies to many other indices as well, including the Nasdaq QQQ. This hasn’t been much of a concern in a rising market, but the concentration risk may surprise people in a falling market.
We are considering this issue much more as the near singular focus on AI precipitates more conditions analogous to past bubbles. The notion that companies associated with a hot new technology are de facto winners and represent “one-decision” (just buy and hold) is very similar to the exuberance markets had for the Nifty 50 in the ‘70s and internet stocks in the ‘90s. The problems emerge when stock buyers believe that valuation no longer applies to those leading a new trend. The chart below from Bespoke Research shows that the valuation of tech stocks has run far ahead of underlying sales growth, with the value-to-sales ratio definitively past prior peaks.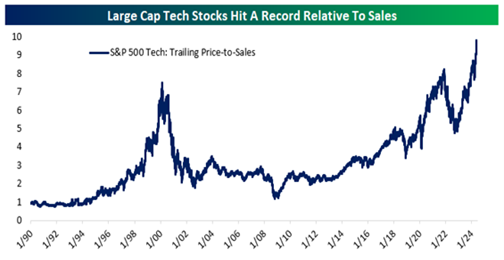
In the second quarter, more data points pointed to an economy that appeared to be slowing down. At least part of the reason stems from the cumulative toll of inflation and higher interest rates on borrowing. These pressures are becoming more evident in consumer trends. The burden is logically evident initially on the lowest income earners, though comments from companies like Walmart suggest it is working its way up the income and wealth strata. Excess savings from COVID, payment avoidance measures for mortgages and student loans, and other programs have made predicting the evolution of this process difficult. However, various macroeconomic measures are now clearly showing the effects.
Preliminary expectations on consumer spending in the second quarter from Fitch Ratings saw the rate of growth slow to 1.9% from 2.2% recorded in 2023. Real disposable income growth weakened, resulting in a softening of retail sales and a pick-up in loan delinquencies. For the most part, dips in economic activity post-COVID have been short-lived because the jobs market has remained solid. However, in the second quarter, the employment market started to cool off with a pick-up in new jobless claims, an increase in continuing claims, and an increase in the unemployment rate. For perspective, the U.S. is coming off an extended period of a historically low unemployment rate, so the weakness is far from a calamity. However, the softening is something markets will be watching closely. The graph below from the Federal Reserve shows how the unemployment rate looks to be making a turn upward.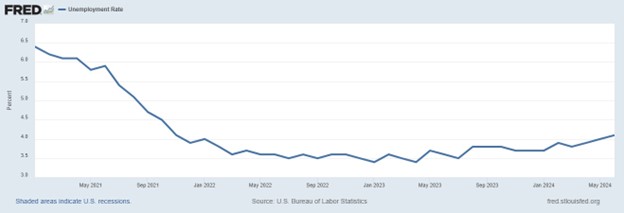
We think the employment picture is more critical in assessing the economic outlook and the risk of a recession. Two of the most reliable recession predictors are an inverted yield curve and an acceleration of unemployment. The yield curve has been inverted for about two years. While we have not had a recession, the distortions of the zero-interest rate environment proceeding it and the COVID stimulus may explain the break in the relationship though this cycle.
Forecasting a recession from an employment downturn relies on the Sahm Rule. This indicator uses an acceleration in unemployment relative to the past year to predict a recession. Studied and put forth by a Fed economist, the Sahm Rule analysis suggests a high likelihood of recession if the unemployment rate rises by 0.5% over the preceding 12-month average. The rule hasn’t been triggered as of July, but it is very close. If the economy exhibited both an inverted yield curve and accelerating unemployment, avoiding a steeper slowdown would seem difficult.
Ironically, the most evident impact of AI deployments seems to be using technology to cut customer-facing employees (jobs). How fast this substitution moves will depend on company experience – the benefit of reducing labor costs versus any negative impacts on customer satisfaction. As a concept, AI sounds like a great way to perform these services for reduced costs, but running across people who prefer service via an autonomous bot is few and far between. At this stage, we don’t see AI deployments as a big needle mover on total employment, but at the margin, it doesn’t appear to be a positive force for the employment equation.
The slowdown in consumer spending and cooling job market feed back into business activity, which also showed signs of moderation in the second quarter. While measures of manufacturing activity have oscillated between growth and expansion for years, the climate for services industries has held up more consistently. Recent survey data indicates these conditions are tilting down. The graph below of the Institute for Supply Management (ISM) survey of services businesses illustrates this cooling trend. The blue line at 50 is the essential over/under in the survey context on whether conditions are expanding or contracting. The reading is a composite of data on several variables that drive respondents’ operations.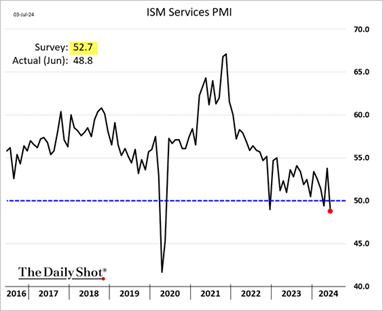
Slowing job gains, moderating consumer spending, and a softer business climate can all work to tilt economic activity from growth to a recession. In our view, the job trend may be the most essential piece of data for investors in assessing the risk of recession versus soft-landing. A full-blown recession can see stocks down by 30% or more, though there are more extreme cases that usually involve extenuating circumstances. Though recessions have come and gone many times, investors’ evaluation of the risks in advance can lead to better capital preservation during a downturn. Waiting for the official declaration of a recession is generally too late. The official recognition comes through a process that often doesn’t even officially acknowledge the recession until after it is over.
One positive a slowing economy offers is less pressure on inflation. The inflation rate has improved over the past year partly through a cooling of demand and partly from easier comparisons. It remains above the current Fed “target” of 2.0%, but at around 3%, it is no longer the singular focus of policy or business leaders. To the latter point, it is interesting to see how different issues dominate quarterly updates with investors. The chart below from Factset tallies the frequency of the term “inflation” on company earnings calls to gauge the issue’s severity. The graphics reflect the ebbing focus coinciding with cooler government CPI reports. This doesn’t diminish the cumulative effect of price increases, though it does reduce the pressure on policy and may allow the Fed more flexibility to address an economic slowdown.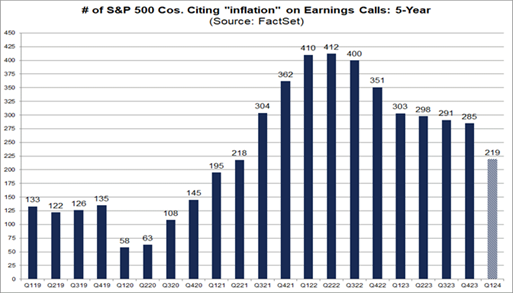
Near-term improvements notwithstanding, we think investors will still need to plan for higher average inflation in the years ahead. Among the identifiable risks to future inflation is the deglobalization of trade and the deteriorating fiscal position of the U.S. and other developed countries. Fractured relationships with global producers (principally China) and threats to established trade routes increase the complexity, time, and costs of international business. The U.S. remains a significant net importer of most consumables, meaning costs due to a more fractured and complex supply chain flow to U.S. consumers. Violence in the Middle East and the Red Sea is again diverting trade and increasing the cost of international goods transportation.
At the same time, we face these challenges with arguably the most difficult fiscal position the U.S. has held in modern times. The annual deficit adds to an already precarious debt situation at a rate not seen during expansionary times. The challenges of this situation are already percolating in markets. Regular Treasury auctions that used to be routine affairs are now being closely watched to assess the appetite for U.S. debt demand as there is more supply to sell, and many foreigners become net sellers.
Meanwhile, the expanding debt balance against a backdrop of higher interest rates results in rapidly rising costs to service that debt. Interest expense is fast becoming one of the most significant budget items. Last month alone saw interest expense exceed $140 billion, or a run rate of $1.7 trillion annually. Unfortunately, these numbers have been exceeding forecasts for some time. However, despite this situation, no one in politics seems serious about addressing the issue. The graph below is a baseline estimate from the Congressional Budget Office that projects spending will grow faster than receipts for years to come. One way or another, the gap needs to be filled by having more money in circulation, which in turn devalues our currency’s purchasing power.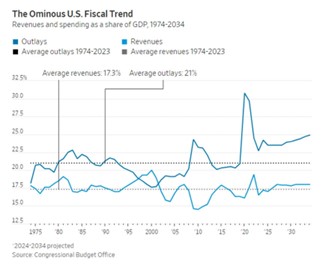
Whether the economy continues a graceful slowdown or slips into something more recessionary in the coming months will probably depend on the jobs picture and interest rate policy. In the last few months, slowing consumer behavior and the slip in employment have raised some incremental concerns, in our view. Having worked through the COVID surplus savings and with fewer stimulus programs on the horizon, most consumers have less flexibility to deal with toughening economic conditions. We think the Fed is sensitive to this risk, and, as noted, the softer inflation readings of late provide cover to adjust policy. We expect the Fed’s next move in interest rate policy will be a cut, with the market heavily focused on the September meeting for action. However, we wouldn’t rule out the possibility of it coming sooner at the July meeting.
In our opinion, the performance concentration in the second quarter turns up the market risk dial. So much attention and capital has gone to chasing a common idea that any disappointments on that path could be quickly magnified in the market. As noted earlier, just six companies are currently responsible for almost a third of the return in the S&P500, and they greatly influence several other indexes and funds. Collectively, this action has appeared to make investors more bullish, not less, and as a result, they are doing comparatively little hedging. The following chart of the put (downside protection) to call (upside speculation) ratio is frequently used as a contra-indicator measure of sentiment. The exceptionally low volume of puts relative to calls suggests a diminishing number of people are concerned about market risk.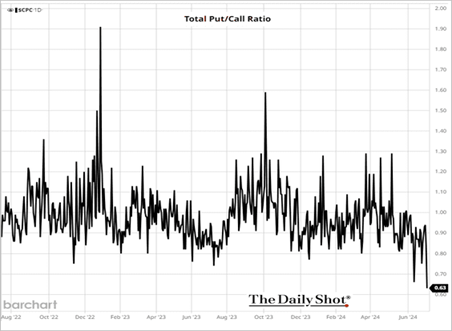
The flip side of concentrated performance is that many other assets have been left behind and may offer more attractive value, particularly on a relative basis. Our incremental additions, adjustments, and research have focused more on these opportunities than chasing the runaway train. For example, solid, dividend-growing companies typically make attractive long-term investments, though they have underperformed considerably over the past 18 months. Likewise, international markets have lagged U.S. markets for years now, despite many foreign companies that trade at a fraction of the valuation of U.S. companies while offering high dividend payouts. We think both groups could be better relative performers if the economy and market stumble. We also keep a positive view of commodities and precious metals. Economic slowdowns are typically not a good environment for commodities, but inflation in the form of currency proliferation should translate to higher nominal prices.
In past letters, we tried to identify risks and opportunities for the economy and market while always noting that the future holds a list of unforecastable developments. The universe of possibilities in that category only seems to multiply. Questions will often come up around this time about the upcoming election cycle and what different outcomes might hold. This cycle is proving to be positively surreal. At this juncture, our only relative view of any confidence is that whatever the outcome, it is not likely to turn the fiscal spending tide anytime soon. We believe recognition and action won’t happen until the problem is forced upon them. In the meantime, our objective is to be aware of the risks for savers and attempt to position portfolios appropriately. As developments unfold, we will continue communicating any changes in our view and corresponding implications for client allocations. We thank you for your continued trust in us and hope you and your family remain in good health.
Bradley Williams, Chief Investment Officer
Lowe Wealth Advisors
Please remember that past performance may not be indicative of future results. Different types of investments involve varying degrees of risk, and there can be no assurance that the future performance of any specific investment, investment strategy, or product (including the investments and/or investment strategies recommended or undertaken by Lowe Wealth Advisors, LLC), or any non-investment related content, referred to directly or indirectly in this newsletter will be profitable, equal any corresponding indicated historical performance level(s), be suitable for your portfolio or individual situation or prove successful. Due to various factors, including changing market conditions and/or applicable laws, the content may no longer be reflective of current opinions or positions. Moreover, you should not assume that any discussion or information contained in this newsletter serves as the receipt of, or as a substitute for, personalized investment advice from Lowe Wealth Advisors, LLC. To the extent that a reader has any questions regarding the applicability of any specific issue discussed above to his/her situation, he/she is encouraged to consult with the professional advisor of his/her choosing. Lowe Wealth Advisors, LLC is neither a law firm nor a certified public accounting firm and no portion of the newsletter content should be construed as legal or accounting advice. A copy of the Lowe Wealth Advisors, LLC’s current written disclosure statement discussing our advisory services and fees is available upon request. If you are a Lowe Wealth Advisors, LLC client, please remember to contact Lowe Wealth Advisors, LLC, in writing, if there are any changes in your personal/financial situation or investment objectives to review/evaluating/revising our previous recommendations and/or services.